

Integration-as-a-Platform for Private Equity
We make corporate integrations succeed
in the sixty days that decide the deal.
OpCadence is the methodology, playbook, platform, and AI agents that take a private equity rollup from close to a Day 60 scorecard. We integrate the people, process, and technology of every acquired company on the same blueprint, every time. Built for operating partners and deal partners running platforms in field services, technology, healthcare, and business services.
First wave
Day 60
Synergies in the financials
Reporting
Real time
Was 2–4 weeks
Attrition
<10%
Voluntary, during integration
Cost
60–90 bps
Of deal value, was 2–3%
What OpCadence is
A four-part operating system for the first sixty days after close.
OpCadence is the only product that combines the four things every successful integration needs in one installed system. Methodology, playbook, platform, and AI agents are sold together because they only work together.
Part 1 / 4
Methodology
Phase 0 to Phase 3 blueprint. Five workstreams. Six KPIs. One weekly cadence. The same play across every acquisition in the fund.
Part 2 / 4
Playbook
Pre-close checklist. Day 1 communications. Decision-rights matrix. Phase exit gates. Written for the operator running the acquisition, not the consultant flying in.
Part 3 / 4
Platform
Sponsor dashboard, management dashboard, scorecard publication, action items, decision log. Multi-tenant. Live. Replaces the weekly status deck.
Part 4 / 4
Agents
Supervised software workers for finance, AR, billing, vendor reconciliation, and reporting. Shadow mode by Day 7. Supervised by Day 21. Back-office headcount replanned by Day 60.
Why the first sixty days
Integration is where the deal is won or lost.
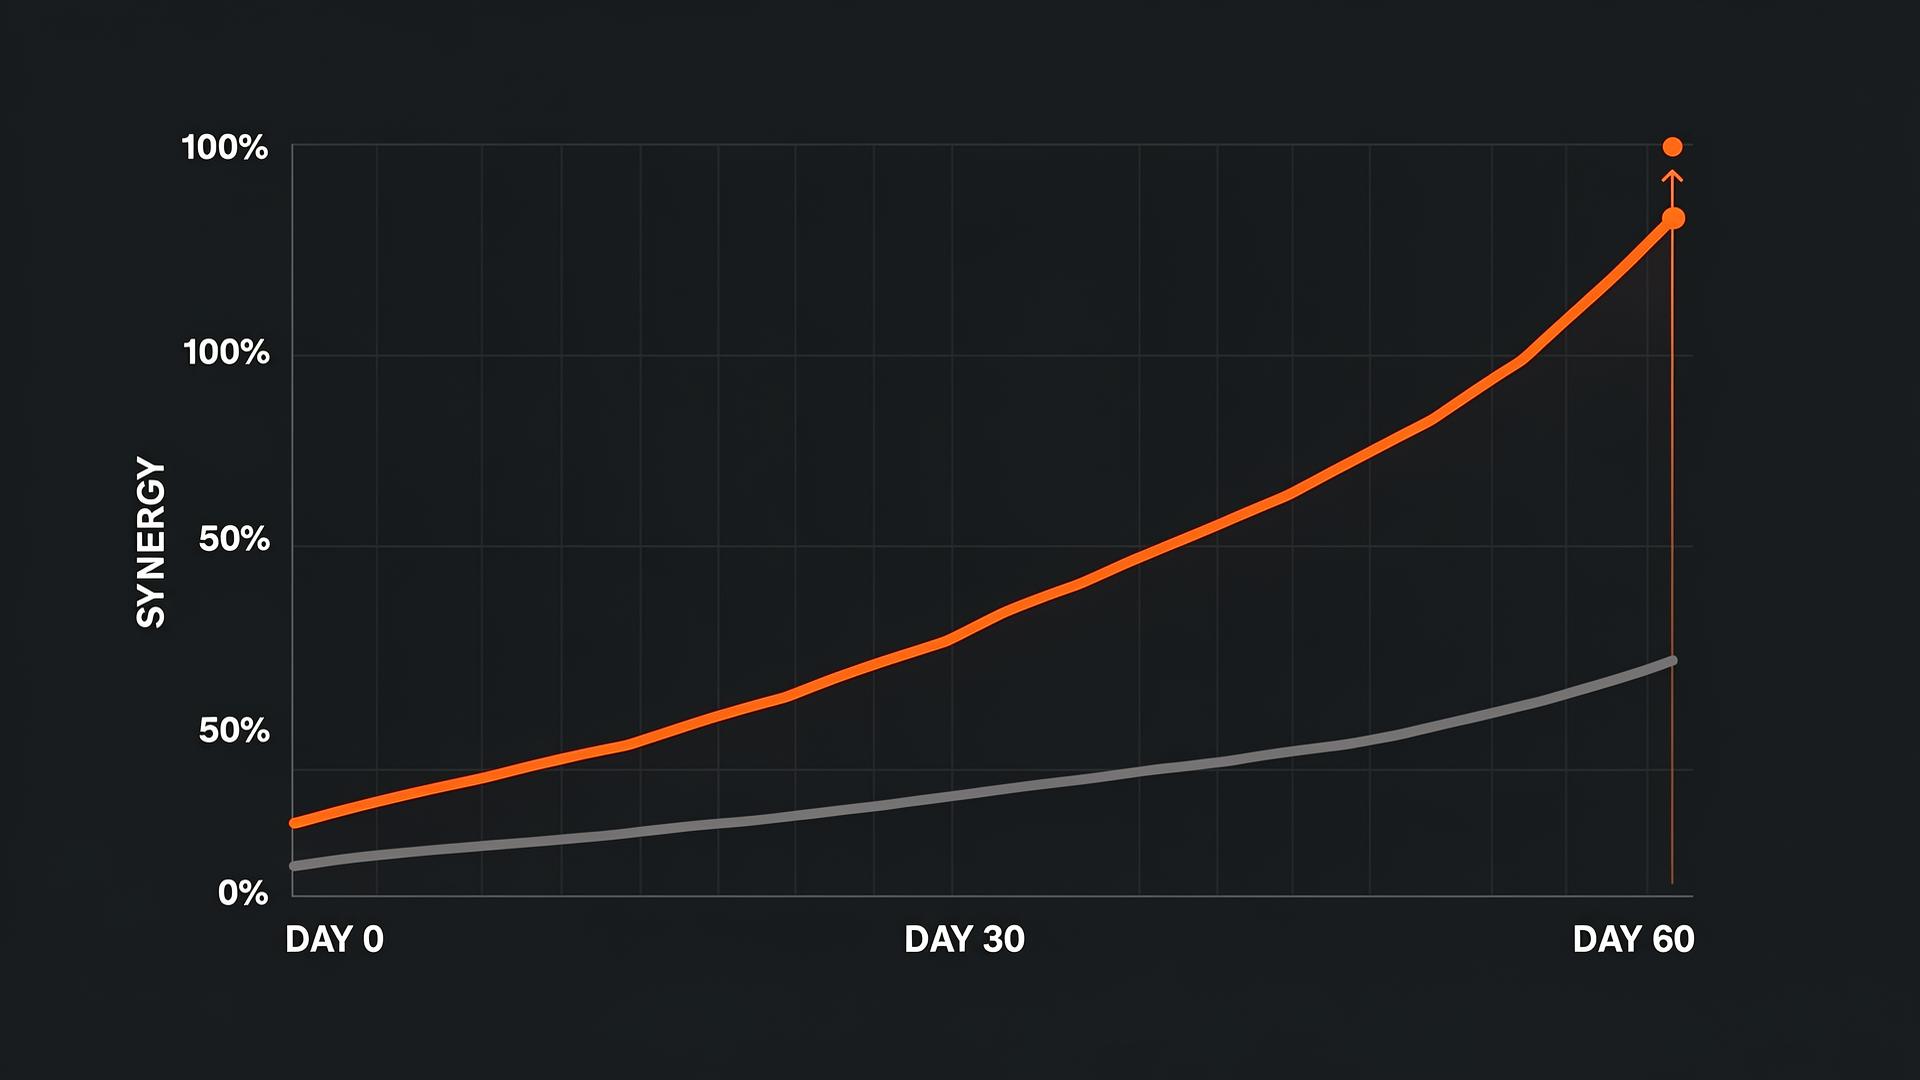
Sixty to seventy percent of acquisitions miss their year-one synergy targets. The median miss is twenty to thirty percent of plan. The cause is rarely the deal thesis. It is the execution of the first sixty days. Sponsors lose synergies, lose top talent, and lose customer trust during the window where their attention is least available and their reporting is least reliable.
How it works
Four phases. One scorecard. No surprises.
P0 · Pre-close
Confirm Day 0 readiness. Pre-stage agents and tenant. Sign the integration blueprint.
P1 · Day 1 to 30
Hold the work. Tell the team. Activate dashboards. Quick wins on the board by Day 30.
P2 · Day 30 to 60
Synergy capture. Workflow scaling. Day 60 acquisition scorecard signed.
P3 · Day 60 onward
Steady state. Standard operating cadence. Roll the team to the next acquisition.
Three roles.
Steering Committee, OpCadence Integration Lead, Workstream Owners.
One meeting.
Weekly cadence, forty-five minutes, scorecard-led, no status theatre.
Zero binders.
Every decision is logged. Every blocker has an escalation timer.
Built for
Lower middle market sponsors running rollups.
OpCadence is sharpest where the same integration runs five, ten, or thirty times across a fund. The product was built with operating partners and roll-up CEOs, not for them. We do not serve mega-cap LBOs and we do not serve growth equity.
- Field servicesHVAC, plumbing, landscaping, refrigeration, electrical, fire and safety
- Healthcare servicesDental, dermatology, ophthalmology, behavioral health, physical therapy
- Business servicesInsurance brokerage, accounting, IT services, security, staffing
- Industrial servicesDistribution, environmental, equipment rental, light manufacturing
- Home servicesGarage doors, roofing, painting, pool, foundation, restoration
What gets reported
Six metrics. Every Friday.
The OpCadence scorecard is the source of truth for every integration review. Sponsor, management, and frontline see the same numbers, with appropriate scope.
Metric
Owner
Value
Status
Synergy capture
Integration Lead
$3.4M
Integration cost
CFO
72 bps
Key account retention
CRO
98.2%
Voluntary attrition
CHRO
6.4%
Milestone delivery
PMO
27 / 30
Operating EBITDA
CEO
$11.8M
SYNERGY CAPTURE / INTEGRATION COST / KEY ACCOUNT RETENTION / VOLUNTARY ATTRITION / MILESTONE DELIVERY / OPERATING EBITDA

01 — Methodology & Playbook
Phase 0 to Phase 3. Same play, every acquisition.
Five workstreams — Operations, Finance, Sales, Human Capital, Technology. Six core KPIs. One weekly cadence. Pre-close checklists, Day 1 communication plans, decision-rights matrices, exit gates per phase. Written so a regional GM can execute without translation.
- Phase 0Pre-close. Checklists, decision-rights, exit gates.
- Phase 1Day 1–21. Cash, vendors, payroll, IT cutover.
- Phase 2Day 22–45. ERP staging. KPI instrumentation. TSA exit.
- Phase 3Day 46–60. Hand-off to operating cadence. Scorecard signed.

02 — Platform & Agents
Two dashboards. One scorecard.
A multi-tenant data model with sponsor and management dashboards. Live KPIs, action items, decision log, scorecard publication. Replaces the weekly slide deck. Underneath, supervised agents run back-office workflows: shadow mode by Day 7, supervised by Day 21, headcount replanned around the agents by Day 60.
Sponsor view
Portfolio
Synergy capture, value bridge, integration clock across every platform.
Management view
Newco
Daily queues, exception inbox, agent log, weekly scorecard.
From an operating partner
“We stopped writing one-hundred-day plans. OpCadence runs Phase 0 through Phase 3. By Day 60 we are running the company on the scorecard.”
— Operating Partner, $2.4B AUM lower middle market fund
Run your next acquisition on OpCadence.
Sixty-day pilots are open for the second half of 2026. Two design partner slots remain. Fixed fee. Defined Day 60 scorecard. Reference rights in exchange for the discount.